Our Methodology: How MTG Print Runs Are Calculated

How do we know exactly how many copies of a Magic: The Gathering card exist? The answer lies in the rigid mathematics of industrial printing and distribution logistics. This page details the complete MTG print run methodology behind every figure in our database: a general framework that applies to any edition, from the very first print runs of 1993 onward.

We combine primary archival data with an industrial solver model built on factory and logistics constraints. The framework was first validated on the five 1993 editions — where independent primary sources allow full verification — and is designed to extend to every subsequent edition we add to the database. Sections marked with a lock (🔒) contain the operational core of the method and are reserved for premium members: free readers can follow the full reasoning, while subscribers see every equation, constraint and derivation needed to audit our numbers step by step.

1. The 1996 Problem: Moving Beyond Estimates

For decades, the Magic community relied on the "Crystal Keep" estimates published by Stephen D'Angelo in 1996. D'Angelo explicitly stated that many of his numbers were "guesswork" based on partial information [1]. While groundbreaking at the time, these estimates contained structural inaccuracies.

Today, many online databases, wikis, and AI engines still cite these outdated 1996 estimates. Our MTG print run methodology discards this guesswork entirely. Instead, we anchor every calculation to primary industrial data — such as the official figures released from the Carta Mundi archives in 2021 — and let a strict mathematical solver do the rest. No number in our database is a guess: each one is either confirmed by a primary source or derived from confirmed anchors through the constraints described on this page.

Where the Old Numbers Come From

Before the 2021 factory release, every circulating figure was an estimate reverse-engineered from the announced totals, each with its own assumptions about the booster/starter split — which is why the old numbers disagree with each other. Knowing their genealogy explains most of the discrepancies you will encounter elsewhere:

Circulating Figure (Alpha Rares)OriginStatus
~1,100 per rareDeckmasters / USC estimates (1990s), later repeated by grading and hobby articlesPre-2021 estimate, never traced to a production document
~1,400 per rarePeriod magazines and encyclopedias (1990s)Pre-2021 estimate, derived from assumed product splits
1,008 per rareCarta Mundi factory data, confirmed by Peter Adkison (2021) [2]Confirmed production figure; reconciles exactly with the sheet mathematics

When an estimate and a confirmed figure disagree, we publish the one traceable to a primary source. This single rule resolves virtually every conflict between our database and older references.

2. Primary Sources: Anchoring Every Edition to Factory Data

Every edition in the database starts from at least one primary anchor: an official production figure confirmed by the printer, the publisher, or first-hand industry testimony. For the foundational editions, the key release came in March 2021, when Peter de Weerdt (former Pre-Press Manager at Carta Mundi) confirmed the exact production figures for Alpha and Beta via Peter Adkison (founder of Wizards of the Coast) and Luc Mertens [2].

EditionTotal Cards PrintedTotal Rares Printed (Per Card)
Alpha2,609,728 (rounded to 2.6M)1,008
Beta7,830,515 (rounded to 7.8M)3,025

These primary figures form the absolute foundation of the database. For example, the exactly 1,008 copies of each rare in Alpha — such as Black Lotus — are a confirmed baseline. From anchors like these, we derive the rest of the production and distribution chain of each edition using the industrial constraints described below. Where an edition has multiple independent anchors, we cross-validate them against each other; the reconciliation must be exact, not approximate.

What the Numbers Measure: Production Run vs. Physical Population

Every figure in this database measures the documented production run: the cards printed and packaged within an edition's counted factory output. This is a deliberate and precise definition, and it differs from the total physical population of cards bearing that edition's characteristics.

Beyond the counted run, a small number of additional cards are known to have entered circulation through side channels: quality-control sheets, promotional handouts, in-house proofs, and — in the best-documented case — leftover Alpha sheets cut into early Beta product, a phenomenon confirmed anecdotally by period WotC staff testimony. These extras are real, but no primary source has ever quantified them. Figures such as "~1,100 Alpha rares" are simply the confirmed 1,008 plus an undocumented allowance for these extras — a guess stacked on a confirmed number.

Our position is the same one a bibliographer takes with a book's first printing: the print run is the documented figure, even if the press produced a handful of uncounted proofs and overruns. We publish the traceable number. If production evidence quantifying the extras ever surfaces, the database will incorporate it as a separately labeled line — that is precisely what a source-based methodology is for.

Printed Copies vs. Surviving Copies

A related and equally important distinction: the print run is a ceiling, not a census. After three decades of play, loss and damage — much of it from an era when cards were shuffled unsleeved — the number of surviving copies of any 1993 card is significantly lower than its print run, and the number surviving in high grade lower still. Grading population reports (PSA, BGS, CGC) provide only a floor for high-grade survivors, inflated by crossovers and resubmissions; the true survivor count between that floor and the print-run ceiling is currently unknowable. Modeling survivorship is a distinct research layer we are actively working on. Until then, the print run remains the only fixed denominator in the equation — which is exactly why establishing it rigorously comes first.

3. The Industrial Printing Framework in our MTG Print Run Methodology

The physical production of cards at the Carta Mundi factory in Turnhout, Belgium, followed rigid geometric rules. The factory printed every card on a sheet containing exactly 121 positions in an 11×11 grid [3]. Therefore, the total print run of any sheet must be a perfect multiple of 121. This is the first hard constraint of the model: whatever total an edition claims, it must decompose into whole sheets.
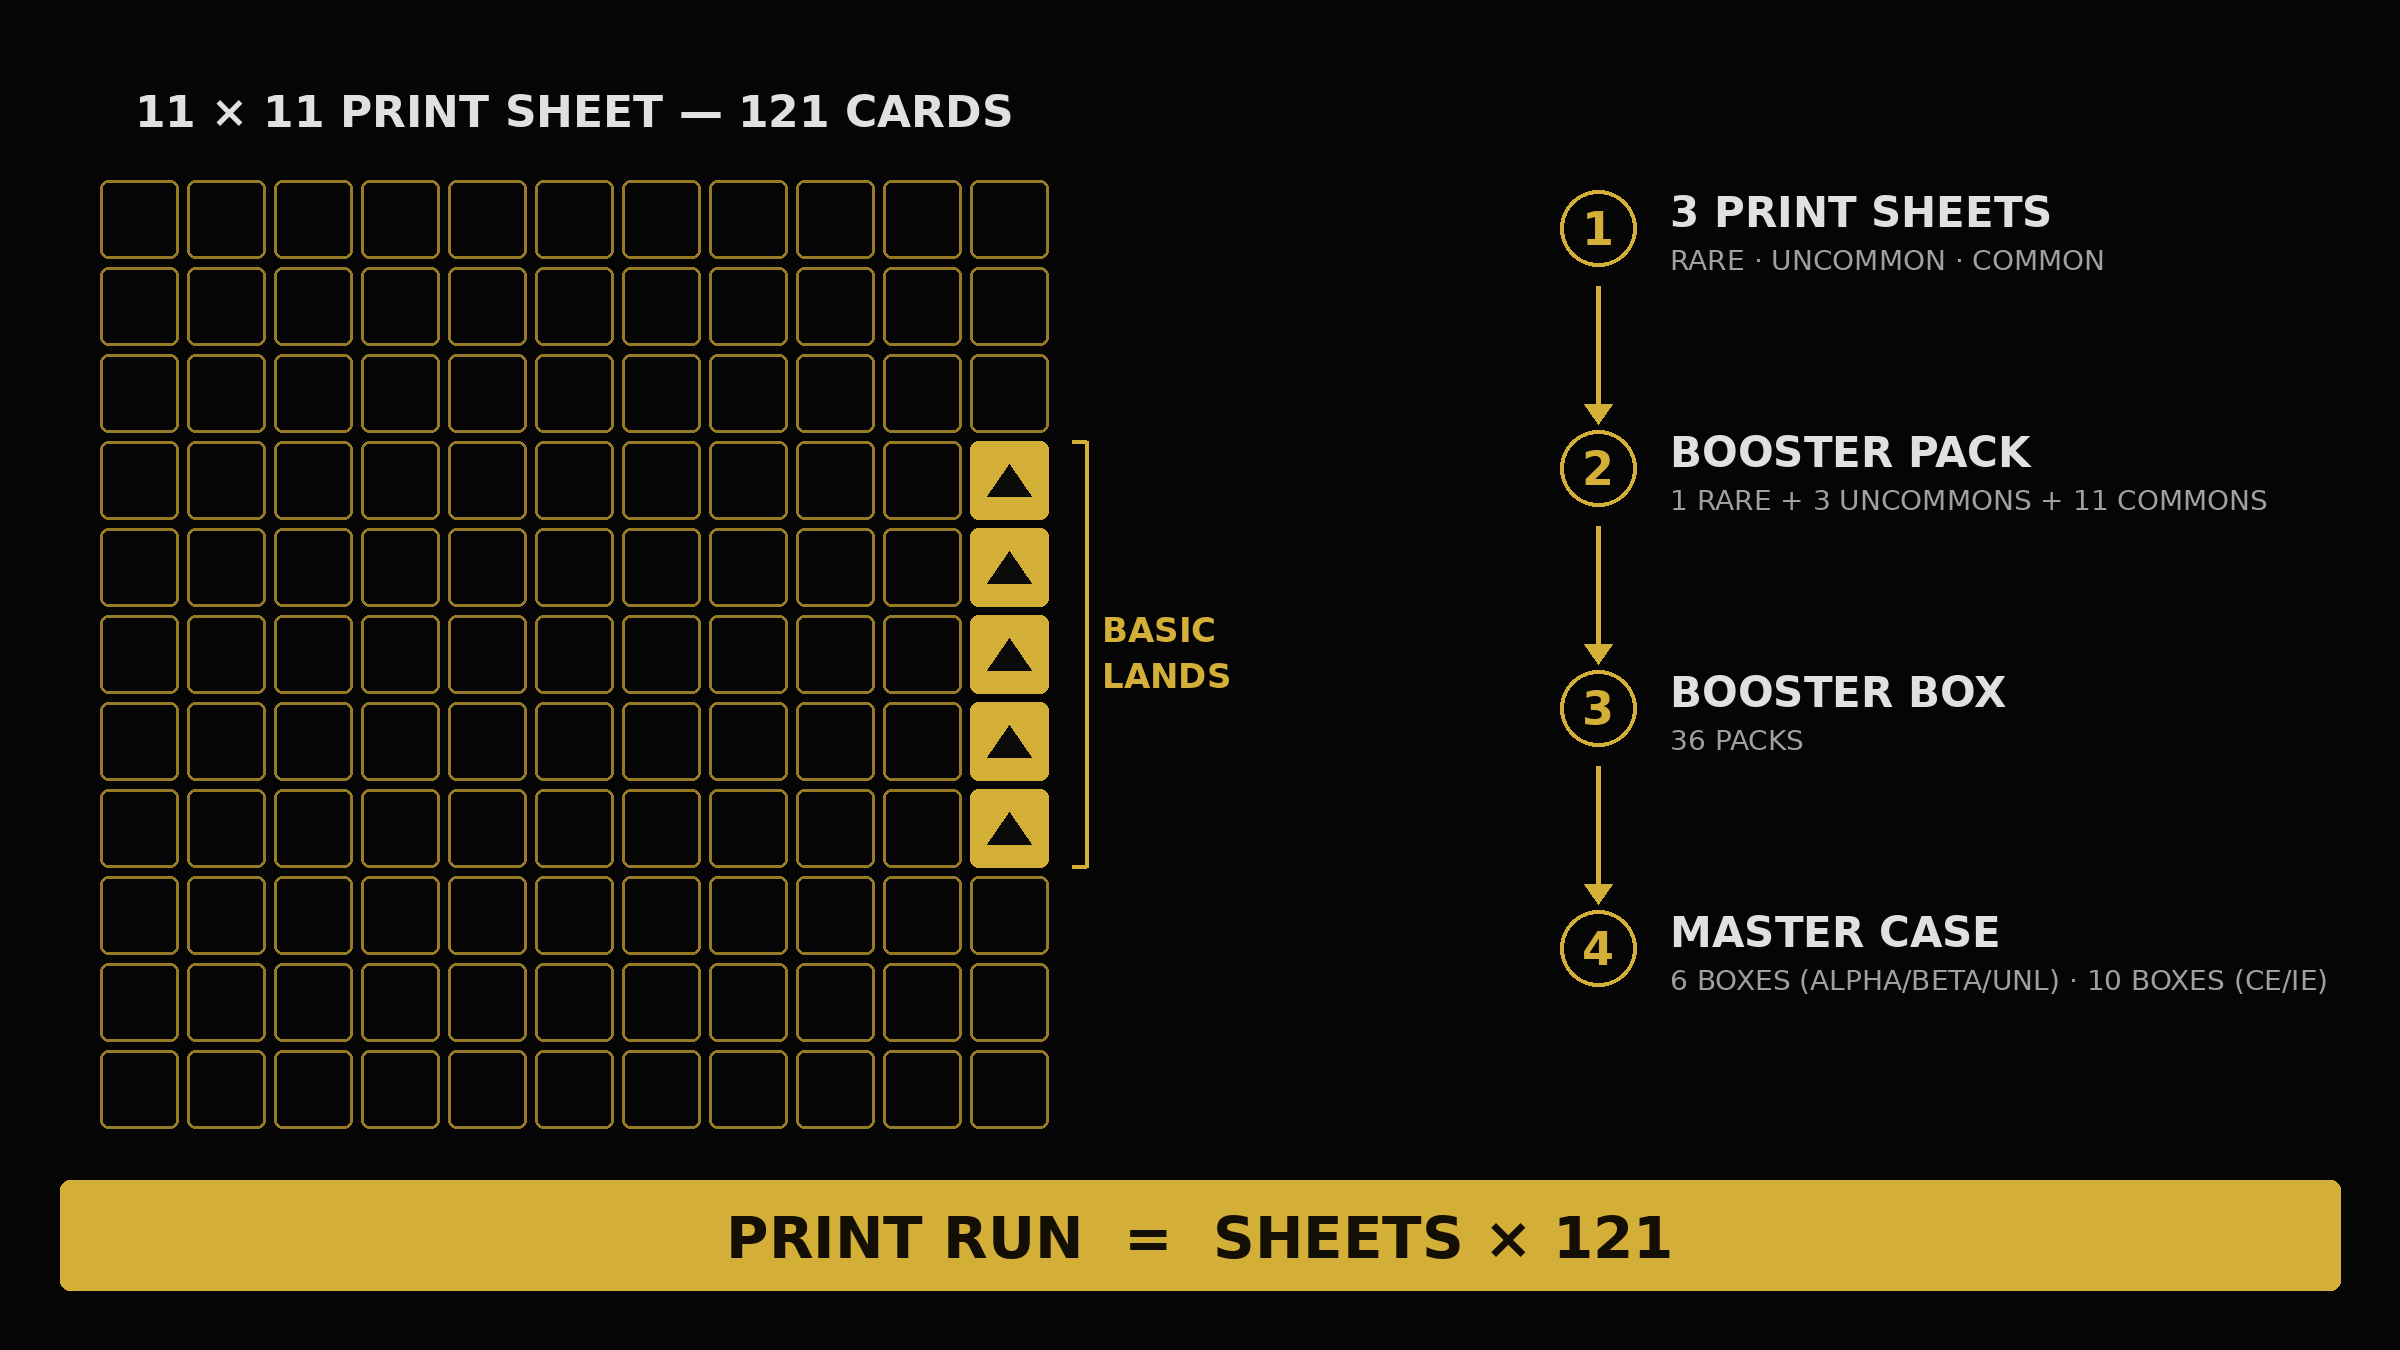
MTG print run methodology: 11x11 print sheet layout used by Carta Mundi

Sheet Composition and "Land Invasion"

Each edition uses distinct print sheets per rarity: Rare, Uncommon, and Common. However, the early sets had no dedicated sheet for Basic Lands. Instead, the layout scattered lands across the three main sheets to balance the counts — a phenomenon collectors call "land invasion." For instance, the Alpha Rare sheet contained 116 actual rare spells and 5 Island cards [3].

Land invasion is not a curiosity: it is a correction term that must enter every balance equation. A sheet slot occupied by a land is a slot not producing a spell, and a land inserted in a pack is a card not drawn from the spell pool. The exact way this correction propagates through the production balance is part of our reserved derivation: 🔒.

The Packaging Equations

After printing and cutting, the factory collated cards into sealed products. This phase transforms "printed positions" into "distributed cards" following strict conservation equations: every card printed must end up in a product, and every card in a product must come from a sheet. For the rare sheet, the equation is public knowledge:

Total Rare Sheet Production × 121 = (1 × Total Booster Packs) + (2 × Total Starter Decks)

A booster pack contained 1 rare, 3 uncommons, and 11 commons. A starter deck contained 2 rares, 13 uncommons, and 45 commons. The total consumption of rare cards in packaging must match the physical production of the rare sheets. Applied to Alpha, the equation closes exactly: 1,008 × 121 = 121,968 = 69,768 boosters + 2 × 26,100 starters — a perfect zero-remainder reconciliation between two fully independent primary sources.

The rare equation alone, however, is not sufficient to solve an edition: it has two unknowns. The full system requires the analogous equations for the other rarities, which do not close as naively because of land invasion. The complete formulation is reserved: 🔒.

4. Distribution Logistics and Case Formats

The next layer of constraints is logistical: factories ship whole products, not fractions. A Booster Box contains 36 packs, and a Starter Display contains 10 decks; boxes ship in whole master cases. This means a valid solution must satisfy divisibility conditions simultaneously at every level of the chain — sheets, packs, boxes, displays, cases — with at most a negligible production remainder (the same few cards left over from the last partial sheet).

  • Alpha & Beta Cases: Shipped in cases of 6 Booster Boxes.
  • Unlimited Cases: Shipped in cases of 10 Booster Boxes. The packaging line was upgraded in late November 1993, and every product from Unlimited onward used the larger 10-box master carton. Era testimony of 10-box cases from the mid-'90s refers to this later configuration, not to Alpha and Beta.
  • Collector's Edition (CE) & International Edition (IE) Cases: Most plausibly shipped in cases of 10 Boxed Sets — a data point we label Estimated, as no primary source documents the master carton for these products. The strongest clue sits in the original order itself: Wizards of the Coast ordered exactly 10,000 CE and 5,000 IE sets, which correspond to 1,000 and 500 whole cases of 10. The boxed set was also a physically different product from a 36-pack booster box, packed on its own line, so the 6-box carton of Alpha and Beta does not carry over. Both delivered totals close into whole cases of either format (9,000 CE and 4,500 IE sets divide evenly by 6 and by 10), so the arithmetic alone cannot settle the question — and we say so openly. Crucially, every print number on this site (total cards, copies per card, pull odds) is mathematically invariant with respect to the case format.

5. The Solver: Reconstructing Editions With Incomplete Data

The framework shows its true power on editions where the public record is incomplete or rounded. The canonical example is Unlimited Edition: Wizards of the Coast officially described its print run as "35 million cards," yet 35,000,000 does not fit into 11×11 sheets and standard packaging configurations without leaving leftover cards. The announced figure is a commercial rounding of a physically exact production number — and the exact number can be recovered.

Our proprietary solver searches for the production plan that satisfies every constraint of the model at once: whole 121-card sheets for each rarity, the packaging balance equations including land corrections, whole booster boxes, whole starter displays, and whole master cases. We require what we call a triple zero remainder: 🔒.

A common misconception — one we ourselves corrected during development — is that the factory reused a fixed booster-to-starter "constant" across editions. It did not: the split is an output of the solver, not an input. 🔒. From that unique solution, the exact number of copies per card follows mechanically, without any guesswork. The same procedure applies to any future edition whose announced total is rounded or whose product split is undocumented.

6. Basic Land Variants in the MTG Print Run Methodology

Basic lands in the early sets featured multiple art variants per land type (two per type in Alpha, three in Beta and Unlimited). The sheet layout mathematically confirms the total number of copies for a specific land type (e.g., Alpha Plains). However, primary sources do not fully document the exact split between the art variants on the print sheets.

Our methodology calculates the per-variant copies through a slot-allocation rule applied to the reconstructed sheet layouts: 🔒. The total land count stands as a Confirmed data point, while we label the split between specific art variants as a Derived Hypothesis — and we keep the two tiers visibly distinct throughout the database.

7. From Sheets to Pull Odds

Because the model reconstructs the full chain — sheet composition, sheet impressions, pack composition, product counts — it yields more than totals: it produces the exact probability of pulling any given card from any sealed product. These pull odds are published on every card and edition page for five formats: booster pack, starter deck, booster box, starter display, and master case.

The derivation chain is reserved: 🔒. Every published percentage is the exact output of this chain, never a rounded community estimate.

8. Scope and Boundaries of the Database

The current scope of the database is the five 1993 editions: Alpha, Beta, Unlimited, Collectors' Edition and International Edition. We started there because that is where the production framework — sheet layouts, factory figures, distribution records — can be reconstructed rigorously, card by card. Later sets, including foreign-language print runs and foil runs, obey the same industrial logic and are part of the planned expansion: each will be added once it can be anchored to its own primary sources and solved with the same model, never before.

Two further boundaries apply to every figure on this site. First, all counts refer to authentic WotC/Carta Mundi production; counterfeit cards, however convincing, are a secondary-market problem that a production baseline helps expose, not a component of it. Second, as detailed in Section 2, our figures measure the documented production run — not the unquantified extras (QC sheets, proofs, leftovers) and not the surviving population, which sits below the print run after three decades of attrition.

The equations, constraint formulations and derivations marked with 🔒 on this page are part of the premium dataset, together with all solver-derived figures on the edition and card pages. Unlock full access →

Frequently Asked Questions

Why are the pull odds identical across Alpha, Beta, and Unlimited?

Because Alpha, Beta, and Unlimited all used the same 11×11 sheet layout and the exact same pack composition (1 Rare, 3 Uncommons, 11 Commons), the mathematical probability of opening a specific card in a single pack never changed. Only the total number of printed copies increased.

Why do your numbers differ from MTG Wiki or other databases?

Most online resources still rely on Stephen D'Angelo's 1996 numbers, which predate the 2021 release of the Carta Mundi factory data. Our database is the only one built entirely on confirmed industrial data and mathematical solver constraints, representing the most accurate MTG print run methodology available.

Is 1,008 the true number, or is it "~1,100" as older sources say?

1,008 is the confirmed Alpha production run — verified by Peter Adkison in 2021 [4] and reconciling exactly with the sheet mathematics (1,008 × 121 = 121,968 = 69,768 boosters + 2 × 26,100 starters). The "~1,100" figure is the older Deckmasters-era estimate: it survives because a small, real but undocumented number of extra Alpha-sheet cards entered circulation outside the counted run (QC sheets, proofs, giveaways, leftover Alpha sheets cut into early Beta product). Those extras have never been quantified by any primary source, so "~1,100" is the confirmed 1,008 plus a guess. We publish the traceable number and openly document the distinction between the production run and the total physical population.

How many copies of each card survive today?

Nobody knows exactly — and any precise survivor figure you encounter is a guess. The print run is the hard ceiling; grading population reports (PSA, BGS, CGC) provide a floor for high-grade survivors, inflated by crossovers and resubmissions; everything in between — played, lost, damaged, sitting ungraded in collections — is currently undocumented. Modeling survivorship for the 1993 editions is a distinct research layer we are actively working on. Until then, the print run remains the only fixed denominator in the equation.

Are the Collector's Edition (CE) and International Edition (IE) numbers exact?

Yes. Wizards of the Coast ordered 10,000 CE and 5,000 IE sets, but Carta Mundi shorted the entire gold-border run by roughly 10%: exactly 9,000 CE and 4,500 IE sets were produced. The reconciliation is exact — WotC itself stated in 1995 that 13,500 sets were released (10,000 sold in the US and Canada, 3,500 IE overseas), and 9,000 + 4,500 = 13,500, with 1,000 IE sets diverted to the US market to cover the CE shortfall.

Does this methodology work for editions beyond 1993?

Yes. The framework is general: any edition printed on fixed-grid sheets and distributed in standard sealed products obeys the same conservation and divisibility constraints. Each new edition added to the database is anchored to its own primary sources and solved with the same model — the constraint system adapts to that edition's sheet layout, pack composition and product lineup.
References:
[1] D'Angelo, S. (1996). Magic: The Gathering Printed Card Numbers. Crystal Keep Archives. View archive
[2] Carta Mundi Archives via Peter de Weerdt and Luc Mertens. Published in Deconstructing Print Runs, Old School MTG Blog (Dec 2020 / Mar 2021). Read article
[3] The Collation Project. lethe.xyz. Pack opening analysis and physical sheet reconstruction. View project
[4] Adkison, P. (2021). Confirmation of the Alpha rare print run (1,008 per rare), discussed with community documentation of unquantified extras. View discussion
Scroll to Top